
People! It is critical that you all become well versed in this material. Methane concentrations are skyrocketing and it’s because of natural gas development.
For a larger version of this graphic to distribute click HERE.
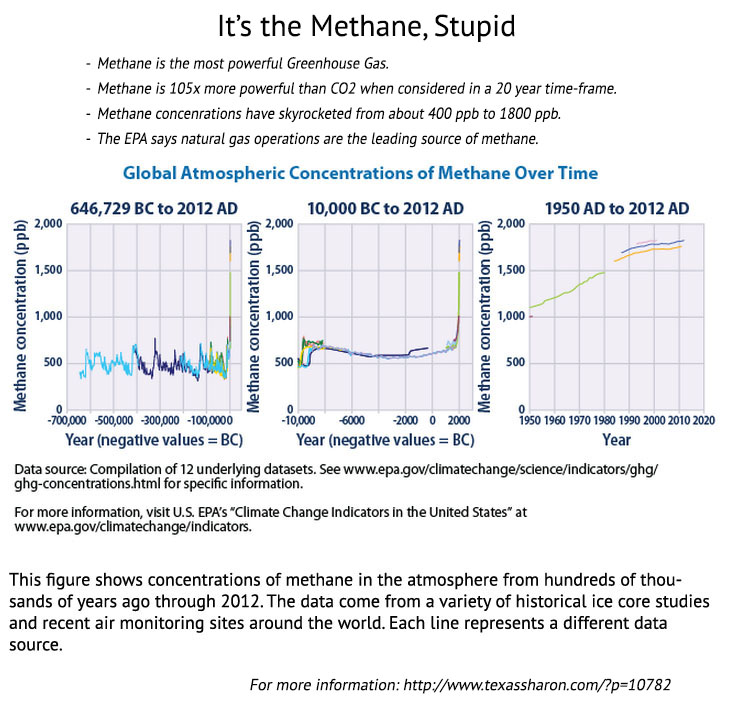
This is indisputable proof. About a dozen universities and governments around the world cooporated in these measurements. They have been peer-reviewed up the wazoo.
For my original post about this please see: The real story about methane and the EPA estimates. You MUST learn this material!

It’s kind of more complicated. Methane comes from many sources at about the same rate. There are ways to isolate methane from the various sources, but for now most measurements for atmospheric methane concentrations doesn’t specify. For instance, methane from oil and gas will have a separate characteristic from say methane generated from a cow or wetlands.
Looking at a graph from a more recent period of time to the present will show a slowdown in total concentration growth rate. This excites some people - as if something positive is happening. Those people have special needs. The probable cause of the methane concentration slow down is loss of global wetlands. From 1993 to 2007 the total area of wetlands throughout the world decreased by 6 percent. This is freaky given only a 15 year period. One can probably attributed this to the industrial growth of Asia and Africa. The US is still holding its own in turning wetlands into stripmalls, but at a slower rate from an earlier 20th century period. Here’s the reference on wetlands loss over this period.
http://news.mongabay.com/2012/0514-wetlands-map.html
Interesting enough, the rate of concentration increase slows down starting in 1993 and slows down some more around 2000. So we’re losing wetlands faster than oil and gas and agriculture can pump it out. Not good. And no, covering up wetlands with asphalt is not an option.
Methane concentration in atmosphere from 1984 to 2005:
http://www.windows2universe.org/earth/climate/greenhouse_effect_gases.html