


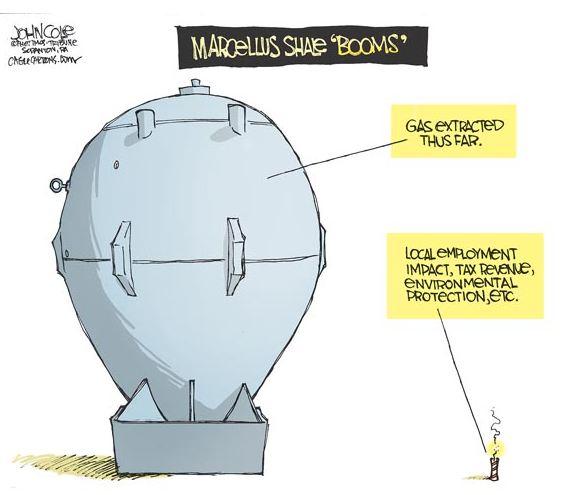
The Marcellus Shale Coalition and IPAA’s PR campaign site, Energy-In-Depth continue to paint a rosy picture of just how much gas there is in the Marcellus Shale. Their slant implies we have so much gas it’s coming out of our A-.
Reports: Marcellus reserves larger than expected | By KEVIN BEGOS | Associated Press | Oct. 20, 2012
PITTSBURGH (AP) — There’s been plenty of debate over the Marcellus Shale natural gas field, but new research adds a twist that could impact political and environmental battles. Two independent financial firms say the Marcellus isn’t just the biggest natural gas field in the country — it’s the cheapest place for energy companies to drill.
One of the reports adds that the Marcellus reserves that lie below parts of Pennsylvania, West Virginia, Ohio and New York are far larger than recent government estimates, while another said the powerful combination of resource, cost and location is altering natural gas prices and market trends across the nation.
The Marcellus could contain “almost half of the current proven natural gas reserves in the U.S,” a report from Standard & Poor’s issued this week said.
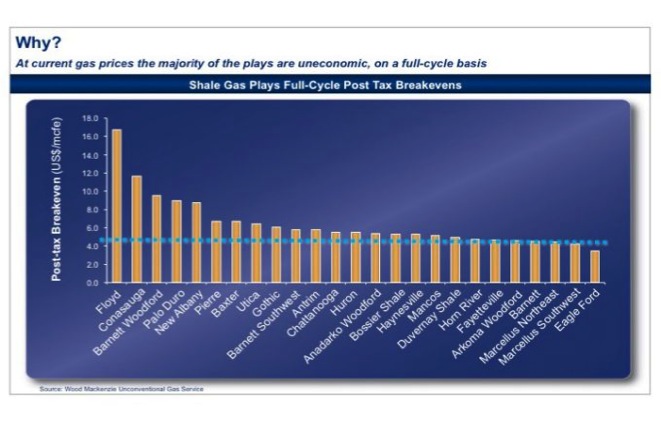
It’s unknown if the above story is the work of an investigative journalist, or a trained stenographer. What is apparent is if you do some digging yourself, the figures do not add up.
Production Decline of a Natural Gas Well Over Time | Geology.com | Hobart King
Excerpt (emphasis added): Horizontal drilling and hydraulic fracturing have been used to produce natural gas from shale for less than a decade in most parts of the United States. However, some general statements can be made about the productive life of a typical well. As described above, these wells will yield at a rapid rate immediately after drilling and the yield will decline rapidly during the first year and then more slowly over time.
This graph shows how the yield of a hypothetical natural gas well has declined over time. It shows a rapid drop in production during the first year and a slowing decline rate in subsequent years.
Specific to the Marcellus Shale region, as cited in the Federal Department of Energy (DOE) report A Comparative Study of the Mississippian Barnett Shale, Fort Worth Basin, and Devonian Marcellus Shale, Appalachian Basin :

Note the Production Decline rate for the Marcellus: 67% in the first 105 days, that’s just a little over 3 months at a cost of $3 to $4 million per well.
To maintain high production rates the Marcellus wells will have to be re-stimulated (re-fracked) more frequently than other shale plays, in turn this will require more water and chemicals and increase the impact it has on water, air, land and people. Furthermore, the wells would need to be drilled in a much closer proximity than other shale plays (using up more land mass) which would mean higher post production costs and less royalty payments for land owners, since most royalties are based on the “profit” after the company recaptures their cost.
The Natural Gas Industry and their PR wing know this. Even their favorite scientist, Terry Engelder (Penn State University, Professor of GeoScience) knows this.
Marcellus | Fort Worth Basin Oil&Gas Magazine | August 2009
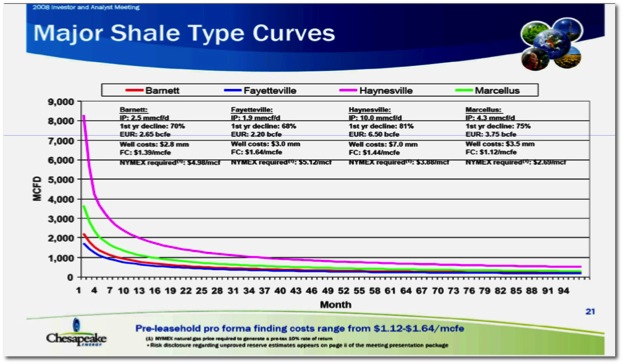
Excerpt: Decline curve models predict rate of flow as a function of time, initial production rate, and a parameter that has the units of inverse time. Because there is not enough public data to define a Marcellus decline curve precisely, I rely on a pro forma decline curve and that curve published in the 2008 Chesapeake investor and analyst report serves well. Chesapeake has a very skilled technical staff and I have confidence in their ability to generate a reasonable decline curve for gas production from horizontal Marcellus wells. The best fit curve for the Chesapeake pro forma curve follows a power-law rate decline with a poor fit to initial production (Fig. 3A). The shape of the three most commonly used production-decline curves, depending on circumstances, are an exponential rate decline, a hyperbolic rate decline, and a harmonic rate decline (Fig. 3B). A power-law rate decline is steeper than the three traditional rate decline curves.

Annual Energy Outlook 2012 - US Energy Information Administration | Release Date: June 25, 2012 | Report Number: DOE/EIA-0383(2012)
Excerpt (emphasis added): The shape of the annual well production profiles associated with the EUR* varies substantially across the plays (Figure 54). For example, in the Marcellus, Fayetteville, and Woodford shale gas plays, nearly 65 percent of the well EUR is produced in the first 4 years. In contrast, in the Haynesville and Eagle Ford plays, 95 percent and 82 percent, respectively, of the well EUR is produced in the first four years. For a given EUR level, increased “front loading” of the production profile improves well economics, but it also implies an increased need for additional drilling to maintain production levels.
* EUR: Estimated Ultimate Recovery

Note the steep decline in the 1-2 year range.
What does all this mean?
Natural Gas Corporations have a great deal at stake, i.e. profits. With the current market price of natural gas, drilling new wells is not profitable. The wells currently “on-line” have glutted the market, and more will be brought “on-line” over the next few months as gathering pipelines are connected to major transport/distribution pipelines. This will further glut the market. The natural gas industry’s talking point blames last winter’s unusually warm temps for the glut.
The steep decline means many of the current wells will need to be “stimulated” (i.e. re-fracked) to boost production and/or new wells drilled closer and closer together so they are all sucking the gas from the same relative source all at the same time . Wells in close proximity to each other tend to be less productive on an individual basis.
All of this costs money. If the Natural Gas Corporation can not make a profit, and reinvest in new wells, they need to get the money from somewhere. That somewhere is from luring in new investors and keeping old investors on board. To do this requires “good news”, dangle the carrot of high returns on investments by painting rosy pictures of high production, downplay the risks, and spin the reports.
As Ralph Eads of Jefferies, one of Chesapeake Energy’s primary investment banks was quoted in a recent New York Times story. He admitted to talking up prices and even had a laugh at the Major’ s expense:
“Typically we represent sellers, so I want to persuade buyers that gas prices are going to be as high as possible…the buyers are big boys – they are giant companies with thousands of economists who know way more than I know. Caveat emptor.”
…………………
Recommended Reading:
- Financial Co-Dependency: How Wall Street Has Kept Shale Alive | By Deborah Rogers | Energy Policy Forum | October 23, 2012
- So, you thought fracking royalties would make you rich. | by TXsharon on October 26, 2012
ShaleShock No Fracking Way Posts:
- Who Wants to be a SHALEonaire?
- Fracking Bust in Fracksylvania
- Aubrey and Ralph – BFF Through Boom and Bust?
…………….
© 2012 by Dory Hippauf


{ 3 comments… read them below or add one }
The authors of the report are ex Jeffries analysts - so the report itself was standard Wall Street hype.
As Ralph Eads of Jefferies, one of Chesapeake Energy’s primary investment banks was quoted in a recent New York Times story. He admitted to talking up prices and even had a laugh at the Major’s expense:
“Typically we represent sellers, so I want to persuade buyers that gas prices are going to be as high as possible…the buyers are big boys – they are giant companies with thousands of economists who know way more than I know. Caveat emptor.”
Doesn’t look like the landowners will ever get any peace since they have to come back and frack and frack and frack.